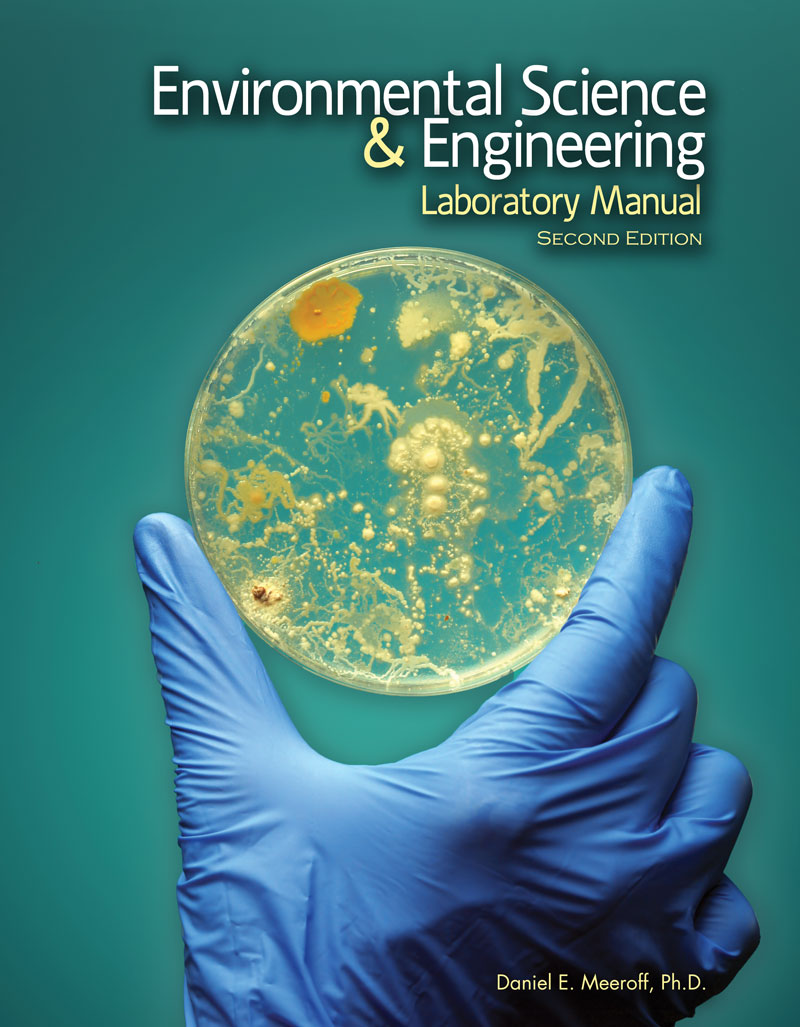
Environmental Science and Engineering Laboratory Manual
Author(s): Daniel Meeroff
Edition: 2
Copyright: 2017
Pages: 102
New Second Edition Now Available!
Environmental Science and Engineering Laboratory Manual provides practical hands-on experience designed to help students understand the theory and practice of environmental engineering principles. It places emphasis on material tested as part of the Fundamentals of Engineering Exam (FE). Civil and environmental engineers rely on laboratory results to make decisions about design and comply with regulations.
Experiments like those found in this manual provide valuable insight into how laboratory results are obtained, used, and reported in the professional world. The manual has been reviewed multiple times for clarity of language and pedagogical effectiveness by past students from Florida Atlantic University to ensure a successful laboratory experience.
LIST OF FIGURES
LIST OF TABLES
PREFACE
LABORATORY SAFETY
THE ROLE OF THE LABORATORY
USE OF EQUIPMENT
ACCIDENTS AND MEDICAL EMERGENCIES
LABORATORY HAZARDS
BASIC SAFETY RULES
DRESS CODE
SAFETY AGREEMENT
LABORATORY SAFETY QUIZ
RECORDING DATA AND STATISTICS
LABORATORY STATISTICS
Curve Fitting
Significant Digits
USEFUL CALCULATIONS
Making Dilutions
Reading the Meniscus
Using a Pipetter
PRE‐LAB RESPONSIBILITIES
LABORATORY REPORTS
ESSENTIAL ELEMENTS
More about the Front Matter
More about the Abstract
More about the Introduction
More about the Hypothesis
More about the Methodology
More about the Results and Discussion
More about the Figures & Tables
More about the Discussion Questions
More about the Conclusions
More about the References
More about the Appendices
GENERAL FORMAT
TRIP REPORTS
ESSENTIAL ELEMENTS
PHOTOGRAPHY
ACTIVITY #1. PH
BACKGROUND
Pre-Lab Questions
Procedure
Discussion Questions
Proper Safety and Disposal
ACTIVITY #2. ALKALINITY
BACKGROUND
Pre-Lab Questions
Procedure
Discussion Questions
Proper Safety and Disposal
ACTIVITY #3. PETRI DISH
BACKGROUND
Pre-Lab Questions
Procedure
Discussion Questions
Proper Safety and Disposal
Appendix
ACTIVITY #4. DISINFECTION
BACKGROUND
Pre-Lab Questions
Procedure
Discussion Questions
Proper Safety and Disposal
Appendix
ACTIVITY #5. OXYGEN DEMAND
BACKGROUND
Pre-Lab Questions
Procedure
Discussion Questions
Proper Safety and Disposal
Appendix
ACTIVITY #6. DO SAG CURVE
BACKGROUND
Pre-Lab Questions
Procedure
Discussion Questions
Proper Safety and Disposal
ACTIVITY #7. SOLID WASTE FACILITY
FIELD TRIP AND WASTE AUDIT
BACKGROUND
Pre-Lab Questions
Procedure
Discussion Questions
Proper Safety and Disposal
ACTIVITY #8. GLOBAL ENVIRONMENTAL
ISSUES
BACKGROUND
Procedure
Discussion Questions
ACTIVITY #9. MASS BALANCE/DILUTION
BACKGROUND
Pre-Lab Questions
Procedure
Discussion Questions
Proper Safety and Disposal
ACTIVITY #10. SOLIDS ANALYSIS AND
CONDUCTIVITY
BACKGROUND
Pre-Lab Questions
Procedure
Discussion Questions
Proper Safety and Disposal
ACTIVITY #11. TURBIDITY
BACKGROUND
Pre-Lab Questions
Procedure
Discussion Questions
Proper Safety and Disposal
ACTIVITY #12. HARDNESS
BACKGROUND
Pre-Lab Questions
Procedure
Discussion Questions
Proper Safety and Disposal
REFERENCES
LABORATORY REPORT RUBRIC
SCORING SHEET
PERIODIC TABLE OF THE ELEMENTS
List of Figures
Figure 1. Do not just store your dirty
glassware in the sink.
Figure 2. Can you spot all of the incorrect
usage of PPE in this picture?
Figure 3. Satellite waste storage area ready
for pickup.
Figure 4. Broken glass disposal container.
Figure 5. Example of a linear correlation
with excellent goodness of fit.
Figure 6. Depiction of a sequential (serial)
dilution.
Figure 7. Location of the fill mark on a 500-
mL Class A volumetric flask.
Figure 8. Location of meniscus (430 mL).
Figure 9. View of thumbwheel for P200
(left) and P1000 (right) pipetter.
Figure 10. P200 calibration of 0.200 mL of
distilled water.
Figure 11. First order plot of concentration
versus time for crystal violet sample #1.
Figure 12. pC-pH diagram for the carbonate
system.
Figure 13. Digitaltitrator.
Figure 14. Theoretical titration curve
showing the location of the
phenolphthalein and bromocresol
green-methyl red endpoints.
Figure 15. Alkalinity test strip.
Figure 16. Diagram summary of the spread
plate technique.
Figure 17. Example of serial dilution
procedure.
Figure 18. Example of monoculture (right)
and multiple colony types (middle).
Figure 19. Mold and fungi growing on the
Petri dish.
Figure 20. Spread plate testing station.
Figure 21. Proper technique for labeling
Petri dishes.
Figure 22. This Petri dish shows a typical
colony marked with a dot, with a
diameter of 1.2 cm.
Figure 23. This Petri dish was made with
0.1 mL of 1/100 dilution and has
creamy white circle colonies. There are
also 57 tiny white colonies that are
more difficult to see. The HPC =
126,000 CFU/mL is derived from two
colony counts 1) 69,000 CFU/mL for
the creamy white circles and 2) 57,000
CFU/mL for the tiny white colonies.
Figure 24. Swabbing technique for
handwashing experiment.
Figure 25. COD digestion heating block.
Figure 26. Spectrophotometer for measuring
COD.
Figure 27. Example of a BOD curve.
Figure 28. Adding seed to the BOD sample
bottles.
Figure 29. Dissolved oxygen meter for
measuring BOD.
Figure 30. Carbonaceous oxygen demand
and nitrogenous oxygen demand curves
over time.
Figure 31. Example of a DO sag curve
profile.
Figure 32. Pie chart of waste categories for
the Standard Hotel, Miami Beach, FL.
Figure 33. Keeling curve of atmospheric
CO2 from the Mauna Loa Observatory
from 1958 – 2017 (Adapted from
Keeling et al. 2001).
Figure 34. Longterm northern hemisphere
departures from the 1961-1990 average
temperature using tree rings, corals, ice
cores, and historical trends 50-year
averages. Most recent data is year-byyear
thermometer-based (Adapted from
Mann et al. 1998).
Figure 35. Screenshot of a full spectrum
scan.
Figure 36. Sample calibration curve
showing absorbance v. concentration.
Figure 37. Bench scale ultrafiltration unit.
Figure 38. Breakdown of solids content in a
water sample.
Figure 39. Example of a turbid sample (right)
and a clear sample (left).
Figure 40. Chemical structure of EDTA.
Figure 41. Hardness test strip.
List of Tables
Table 1. Values of t for Various Levels of
Probability (Skoog et al. 2013).
Table 2. Useful Examples of How to
Properly Understand Significant Digits.
Table 3. Summary of Water Quality
Measurements Taken During
November–December 2017 (Dania
Beach, FL)
Table 4. Alkalinity computation table.
Table 5. Appropriate volumes, cartridges,
and digit multiplier for digital
alkalinity titrations.
Table 6. Typical alkalinity titration
endpoints.
Table 7. Sample waste audit checklist.
Table 8. Summary of membrane filtration
characteristics.
Table 9. Conductivity of typical aqueous
solutions and recommended cell
constants at 25°C.
Table 10. Classes of hardness
(Tchobanoglous and Schroeder 1985).
Table 11. Sample volumes for hardness.

